
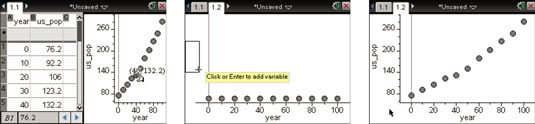
On the TI-Nspire, you can create an x-y statistical plot using two-variable data sets. In this document, the year and U.S. population data is entered into the first two columns of a Lists & Spreadsheet page. The first column, titled year, represents years after 1900. The second column, titled us_pop, gives the corresponding U.S. population in millions.
Highlight both columns and press [MENU]→Data→Quick Graph or right-click ([CTRL[MENU]) and choose Quick Graph. This action automatically splits the page and adds a Data & Statistics application with the x-y plot of the us_pop versus year data. Notice in the first screen, you can move the cursor to any point and press [CLICK] to reveal its coordinates.
Sometimes, it is preferable to use the Data & Statistics application on a full page. To graph this scatter plot to a separate page, follow these steps:
Jeff McCalla teaches Algebra 2 and Pre-Calculus at St. Mary's Episcopal School in Memphis. He is a T3 instructor for Texas Instruments and co- founder of the TI-Nspire SuperUser group. Steve Ouellette wrote the first edition of TI-Nspire For Dummies as well as CliffsNotes ® Guide to TI-Nspire.