A policy memo can either provide a concise summary of information relevant to a policy maker or a policy recommendation for them to implement. It is also possible to provide multiple options for the policy maker to consider implementing. If multiple options are provided, you will want to discuss the pros and cons of each option and give the policy maker the context needed to select one.
Your work or the issue you’re writing about is likely broad and complex, with a great deal of nuance. In a policy memo, you must distill your issue down to the most important points in a single page that a policy maker can use to make a decision.
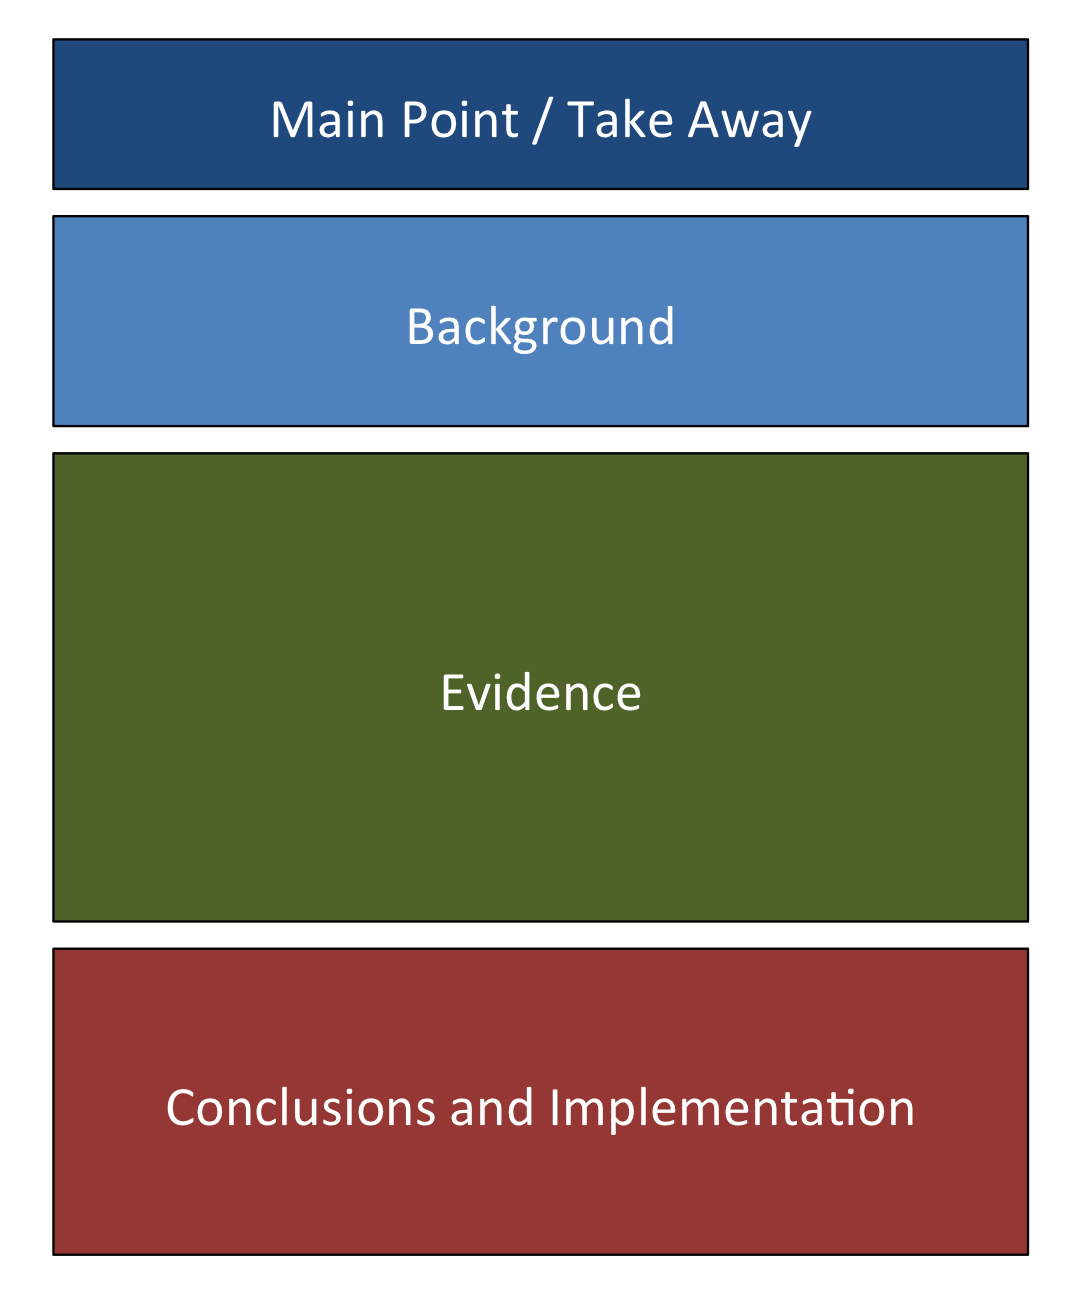
If given limited time to review a document, many people will skim for headers and section titles or read the first sentence of paragraphs to determine the paragraph’s importance. Anticipate the reader’s behavior to increase the impact of your memo:
If you find it necessary to provide a large amount of numerical data, consider if tables or figures may be more appropriate. Listing data in text form can be overwhelming and can obscure the main point being presented. Conversely, use of complicated or unnecessary tables can confused readers and detract from the effectiveness of the memo. Give only the information that is necessary but be ready to provide the full source for any data provided.
Think about the take-away from the data (individual values or trends) and what format most accurately conveys the main point. The best format will vary depending on audience, data, and major points being made.
“The past 5 years have seen an increase renewable generation in New England. In 2011, renewable sources generated 7261 GWh of power, representing 5.6% of annual generation. In 2012, renewable generation increased by over 10% to 8000 GWh of power and represented 6.2% of the 128000 GWh of electrical generation on the New England grid. The amount of renewable generation has continued to grow in both total output in GWh and percent of total generation every year since 2011, increasing to 7.7% of total generation in 2015 with a total generation of nearly 10000 GWh.”
“The past 5 years have seen an increase renewable generation in New England. Table 1 shows how renewable energy generation has grown in both total output in GWh and percent of total generation since 2011.”
Table 1. Annual Renewable Generation on New England Grid
| Year | Total Generation (GWh) | Renewable Generation (GWh) | Total Percent Renewable Generation | Annual Renewable Generation Change |
| 2011 | 129163 | 7261 | 5.6% | |
| 2012 | 128081 | 7991 | 6.2% | 10.1% |
| 2013 | 129377 | 8752 | 6.8% | 9.5% |
| 2014 | 127176 | 9358 | 7.4% | 6.9% |
| 2015 | 126955 | 9747 | 7.7% | 4.2% |
“The past 5 years have seen an increase renewable generation in New England. Figure 1 shows how renewable generation has increased as percent of total generation since 2011.”
Figure 1. Growth of Renewable Generation as a Percent of Total Generation in New England 2011 – 2015.
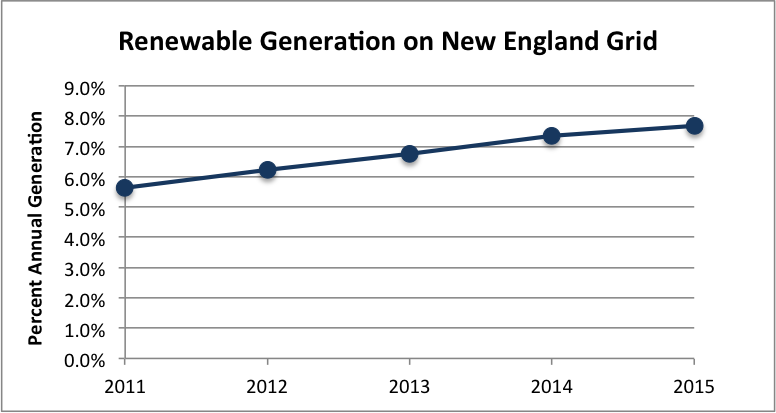
“The past 5 years have seen an increase renewable generation in New England. While total renewable generation continues to increase (7.7% of total generation in 2015), the yearly growth of total renewable generation is slowing.”
NE-ISO Annual Generation Statistics from 2015
Source: Third Way, http://www.thirdway.org/third-way-take/setting-the-stage-for-a-sunshot-for-ccs This example makes effective use of headers and whitespace to emphasize its specific recommendations. 3 MB
Source: Olivetti Group, Massachusetts Institute of Technology 3 MB